Customer 360 Customer Journey Analytics Services
Understand how customers interact with your business across every relevant stage of the customer lifecycle with Customer 360 Customer Journey Analytics.
NuageCX helps businesses connect customer interactions across CRM, ERP, marketing, sales, customer service, e-commerce, websites, portals, and other business systems to analyze customer journeys, identify friction points, understand behavior, improve conversion, and create more connected customer experiences.
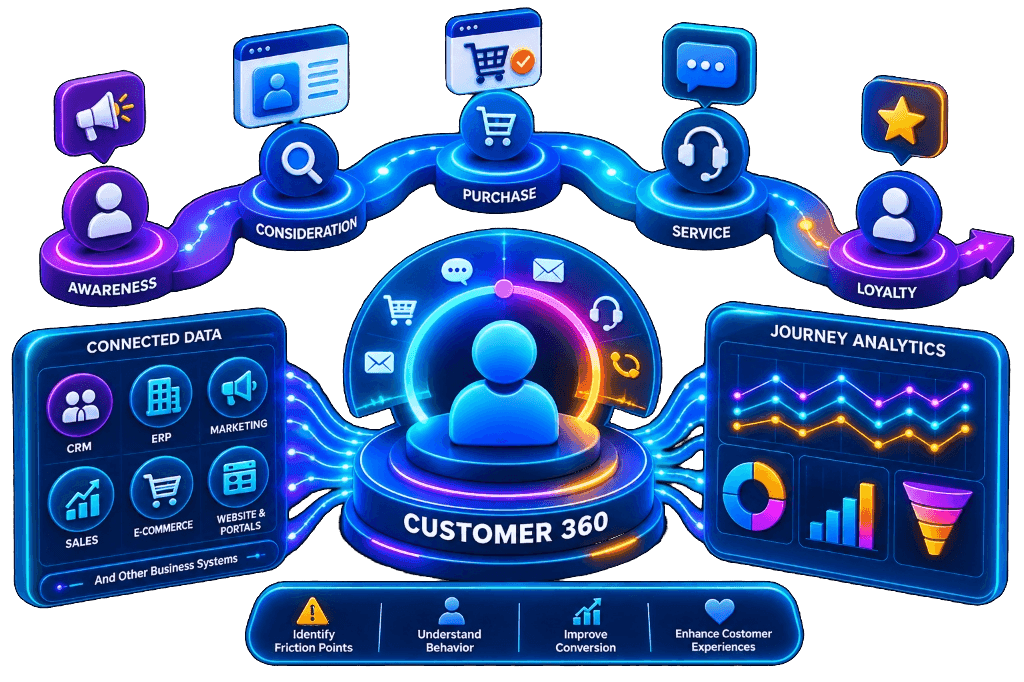
What Is Customer 360 Customer Journey Analytics?
Customer 360 Customer Journey Analytics analyzes customer interactions across multiple touchpoints and connects them into a broader view of the customer journey.
A Customer Journey May Include The Following Progression:
Customer Journey Analytics helps organizations understand what happens at each stage, how customers move between stages, where they experience friction, and which interactions influence business outcomes.
Why Is Customer Journey Analytics Important?
Customer interactions are often distributed across different departments and applications. Customer Journey Analytics connects these perspectives to create a comprehensive understanding of the customer lifecycle.
It Can Help Businesses Identify 10 Critical Journey Gaps:
What Does Customer 360 Journey Analytics Include?
A Customer 360 journey analytics framework encompasses 10 specialized analytical dimensions:
Customer Touchpoint Analysis
Analyze relevant customer interactions across physical and digital channels.
Journey Mapping
Map customer progression across sequential and non-linear lifecycle stages.
Funnel Analysis
Identify conversion rates and drop off percentages between specific lifecycle stages.
Behavioral Analysis
Understand specific customer actions, frequency, intent, and telemetry engagement.
Channel Analysis
Compare customer interactions, touchpoint frequency, and effectiveness across channels.
Conversion Analysis
Analyze speed and probability of movement toward desired business outcomes.
Customer Experience Analysis
Identify service friction, high-effort processes, and systemic experience gaps.
Retention Analysis
Analyze positive behaviors strongly associated with long-term customer retention.
Churn Analysis
Identify early warning patterns and usage anomalies associated with customer churn.
Expansion Analysis
Identify high-propensity signals for potential cross sell and upsell opportunities.
How Does Customer 360 Customer Journey Analytics Work?
NuageCX executes a proven 10-step process to connect cross-system events into actionable journey intelligence:
Define the Customer Journey
Identify the relevant stages of the customer lifecycle tailored to your model.
Identify Customer Touchpoints
Determine where and how customers interact with the organization.
Identify Data Sources
Locate customer interaction and event data across diverse business systems.
Connect Customer Records
Resolve customer identity deterministically and probabilistically across tools.
Standardize Journey Events
Create consistent taxonomy and timestamp definitions for customer interactions.
Map Customer Journeys
Connect unified multi-channel interactions to sequential lifecycle stages.
Analyze Journey Behavior
Identify systemic patterns, conversion velocity, friction, and drop off.
Build Journey Dashboards
Create role-specific analytical command views for executive and operational teams.
Activate Insights
Use journey insights to trigger automated marketing, sales, and service workflows.
Continuously Optimize
Monitor journey KPIs and iterate customer processes based on measurable outcomes.
Customer 360 Journey Touchpoints
Depending on the business, customer touchpoints span digital, sales, service, and account management interactions:
*Only relevant and appropriately governed data should be included based on privacy standards.
Customer 360 Journey Mapping
A customer journey map connects individual customer identities across touchpoints to business outcomes:
Core Conceptual Flow:
Real-World Enterprise Journey Example:
*The actual journey sequence differs significantly by business model (B2B, B2C, SaaS, E-commerce).
Customer 360 Journey Stages
Key transition milestones throughout the end-to-end customer relationship:
Awareness
The customer becomes aware of the organization, product, service, or solution through search, ads, or content.
Consideration
The customer actively researches, reviews comparisons, and evaluates potential solutions.
Evaluation
The customer interacts with sales reps, product demonstrations, digital trials, or technical evaluations.
Purchase
The customer completes a transaction, executes a digital contract, or signs an agreement.
Onboarding
The customer begins product configuration, user training, and implementation workflows.
Adoption
The customer achieves steady-state usage of relevant products, services, or core features.
Retention
The organization maintains relationship health through ongoing satisfaction and support excellence.
Renewal
The customer renews a recurring subscription, enterprise contract, or annual maintenance plan.
Expansion
The customer purchases additional products, services, tier upgrades, or licensing capacity.
Customer 360 Journey Analytics Across Departments
Delivering department-specific intelligence tailored to Marketing, Sales, Service, and CX leaders:
For Marketing
Understands customer movement beyond isolated campaign metrics:
- Customer acquisition
- Campaign engagement
- Content interaction
- Channel performance
- Lead progression
- Conversion analysis
- Segment behavior
- Influenced revenue
For Sales
Provides broader customer context surrounding each opportunity:
- Lead progression
- Qualification depth
- Opportunity velocity
- Sales activities
- Account engagement
- Proposal interactions
- Purchase history
- Expansion leads
For Customer Service
Reveals connections between support cases and overall retention:
- Service interactions
- Support requests
- Product issue trends
- Escalation rates
- Resolution velocity
- Repeat case drivers
- Lifecycle impact
- Customer value risk
For Customer Experience
Identifies friction points and systemic service barriers:
- Friction points
- Repeated interactions
- Drop off patterns
- Delayed processes
- Channel switching
- Service delays
- Customer effort
- Experience gaps
Pre-Retention & Churn Signals
Journey analytics identifies customer behavior sequences that precede attrition:
*Analytical patterns derived from historical data rather than guaranteed causal relationships.
Signals Associated With Churn
Key telemetry signals validated against historical churn outcomes:
- Declining touchpoint engagement
- Reduced purchase frequency or order volume
- Lower product feature adoption
- Increased support case escalations
- Unresolved chronic service problems
- Reduced stakeholder communication
- Approaching renewal without expansion signals
Where Customers Advance or Drop
Journey analytics pinpoints exact milestones where customers:
Customer 360 Funnel Analytics & Conversion Breakdown
Journey analytics measures velocity between lifecycle stages and isolates significant drop off rates:
Customer Journey Lifecycle Funnel:
Conversion Analysis Evaluates 7 Strategic Dimensions:
Multi-Channel & Omnichannel Journey Analytics
Connecting customer interactions across disparate digital, voice, and offline channels into one unified journey:
Multi-Channel Progression Example
Customer interactions rarely occur on a single channel. An enterprise journey spans:
10 Omnichannel Touchpoint Channels
Evaluating the complete experience rather than analyzing channels in isolation:
Industry-Specific Customer Journey Analytics
Tailoring journey tracking algorithms to distinct business architectures:
B2B Journeys
Multi-stakeholder account buying committees:
- • Account hierarchy
- • Decision maker roles
- • Opportunity stages
- • Contract renewals
- • Account expansion
B2C Journeys
High-volume consumer progression:
- • Product discovery
- • Digital engagement
- • Direct transactions
- • Repeat purchases
- • Consumer CLV
E-commerce
Digital cart and checkout funnel:
- • Website Visit → View
- • On-site Search
- • Cart additions
- • Checkout progression
- • Repeat re-orders
SaaS Journeys
Product-led growth and adoption:
- • Lead → Free Trial
- • User Activation
- • Feature Adoption
- • Paid Subscription
- • Usage expansion
Manufacturing
Long-cycle supply and fulfillment:
- • RFQ & Quotation
- • Production tracking
- • Delivery & Install
- • Warranty service
- • Long-term contracts
Customer 360 Journey Friction Points
Journey analytics isolates where friction compromises customer progression:
Illustrative Funnel Drop-Off
Examines where customers stop progressing to target optimization efforts:
*Numbers above are illustrative only; live data is used for actual decision making.
Customer 360 Journey Attribution
Connects touchpoint interactions with final business outcomes according to your attribution methodology:
Journey Analytics & Customer Lifetime Value
Combining journey events with customer value data reveals distinct CLV trajectories:
How Journey Analytics Connects with Other 360 Capabilities
Journey analytics acts as the active behavioral engine across segmentation, data integration, and workflow automation:
With Customer Segmentation
Customer Segmentation identifies who the customer groups are.
Journey Analytics analyzes how those specific groups move through interactions and lifecycle stages.
Combining both reveals journey differences across VIP, SMB, and enterprise tiers.
With Data Integration & Unification
Connects interaction records from CRM, ERP, Marketing, Desk, E-commerce, Finance, and Web telemetry into an authoritative representation.
Journey analytics utilizes this unified customer context to reconstruct the chronological journey.
With Workflow Automation
Events detected in the journey trigger governed real-time actions:
- • Sales follow up on demo drop
- • Service escalation on repeat cases
- • Proactive retention on usage decline
Customer 360 Journey Dashboards & Core KPIs
Role-specific analytical views built on unified journey data:
Executive Dashboard
- Customer lifecycle view
- Aggregate conversion rates
- Retention & churn health
- Customer lifetime value
- Account expansion rates
Marketing Dashboard
- Acquisition channels
- Campaign engagement
- Lead progression velocity
- Attribution contribution
- Channel conversion
Sales Dashboard
- Lead stage progression
- Opportunity movement
- Account engagement depth
- Deal conversion velocity
- Cross-sell opportunities
Service Dashboard
- Support touchpoint frequency
- First-contact resolution
- Escalation volumes
- Root-cause issue trends
- Repeat ticket cycles
15 Essential Customer 360 Journey KPIs:
Customer 360 Journey Analytics Challenges
Customer 360 Journey Best Practices
Customer 360 Journey Implementation Roadmap
NuageCX executes structured, phased implementations ensuring rapid time-to-insight:
Phase 1: Journey Discovery
Identify and prioritize the most impactful business customer journeys.
Phase 2: Business Objectives
Define decisions, KPIs, and measurable revenue outcomes for each journey.
Phase 3: Touchpoint Mapping
Catalog customer interactions across marketing, sales, web, and service.
Phase 4: Data Source Mapping
Locate where journey interaction data resides across application silos.
Phase 5: Identity Resolution
Connect records across disparate identifiers into unified customer threads.
Phase 6: Journey Model
Build standardized lifecycle stage schemas and event taxonomies.
Phase 7: Analytics Engine
Analyze conversion rates, velocity, friction barriers, and drop off.
Phase 8: Dashboards
Deploy role-specific visual reporting command centers in Zoho Analytics.
Phase 9: Activation Workflows
Trigger proactive marketing, sales alerts, and support escalations.
Phase 10: Optimization
Continuously refine journey models using measured customer outcomes.
How Much Does It Cost?
There is no universal cost for Journey Analytics. Investment depends on:
- Number of source systems
- Number of customer journeys
- Data volume & cleanliness
- Integration & API depth
- Real-time pipeline needs
How Long Does It Take?
Implementation duration is determined by organizational scope:
- Number of journey pathways
- Source system data availability
- Identity resolution readiness
- Dashboard & KPI complexity
A single high-priority journey pilot can be launched rapidly, whereas enterprise-wide rollout unfolds in phased iterations.
6-Phase Iterative Rollout
When Should a Business Implement Customer Journey Analytics?
Core Conceptual Differences & FAQs
Clarifying key technical and operational concepts:
Mapping vs. Journey Analytics
Journey Mapping visually illustrates hypothetical customer stages and intended experiences.
Journey Analytics connects live enterprise data to measure, quantify, and analyze actual customer behavior across those stages.
Journey Analytics vs. Customer Analytics
Customer Analytics analyzes aggregate customer profiles and demographic attributes broadly.
Journey Analytics specifically tracks the chronological progression of interactions through defined lifecycle gates.
Journey Analytics vs. Segmentation
Customer Segmentation groups customers into cohorts based on shared attributes.
Journey Analytics evaluates how each distinct cohort behaves and moves over time throughout their journey.
Journey Analytics vs. Experience Analytics (CX)
Journey Analytics focuses on objective event movement and conversion progression.
Customer Experience Analytics examines satisfaction, customer effort score (CES), sentiment, and perceived service quality.
Why Choose NuageCX for Customer 360 Journey Analytics?
End-to-end journey modeling, cross-system data engineering, and enterprise Zoho Analytics mastery:
End-to-End Journey Analysis
Connect interactions across the entire customer lifecycle from awareness to renewal.
Cross-System Insights
Harmonize data across CRM, ERP, marketing, sales, service, and e-commerce.
Customer Journey Mapping
Create structured, measurable lifecycle models tailored to your business model.
Journey Funnel Analytics
Identify conversion velocity and drop-off bottlenecks between lifecycle stages.
Behavioral Analytics
Analyze customer actions, engagement frequency, and digital event telemetry.
Customer Experience Analytics
Identify friction points and optimize high-effort touchpoint interactions.
Retention & Churn Analytics
Detect early attrition patterns and trigger proactive customer intervention.
Revenue & Conversion Analytics
Connect customer journeys directly to business pipeline and gross revenue.
B2B Account Journey Analytics
Model complex buying committee interactions across enterprise account hierarchies.
Multi-Channel Analytics
Unify touchpoints across digital, telephony, email, and human sales channels.
Zoho Analytics Mastery
Expert deployment of Zoho Analytics, Zoho CRM, Zoho Desk, and Zoho Books data models.
Turnkey Implementation
Full lifecycle support: discovery, identity resolution, dashboards, activation, and optimization.
Frequently Asked Questions
Everything you need to know about Customer 360 Customer Journey Analytics, implementation, and ROI.
Understand Every Stage of the Customer Journey
A connected customer journey provides more than a visual map. It helps organizations understand customer behavior, identify friction, measure progression, uncover opportunities, and connect customer experiences with business outcomes.