Customer 360 Customer Intelligence Dashboard Services
Turn connected customer data into clear, actionable business intelligence with Customer 360 Customer Intelligence Dashboards.
NuageCX helps businesses bring together relevant CRM, ERP, sales, marketing, customer service, transaction, product, and engagement data to create centralized customer intelligence dashboards for executives and business teams. Monitor customer value, engagement, conversion, retention, churn, sales performance, service activity, customer journeys, and growth opportunities from a connected analytical view.
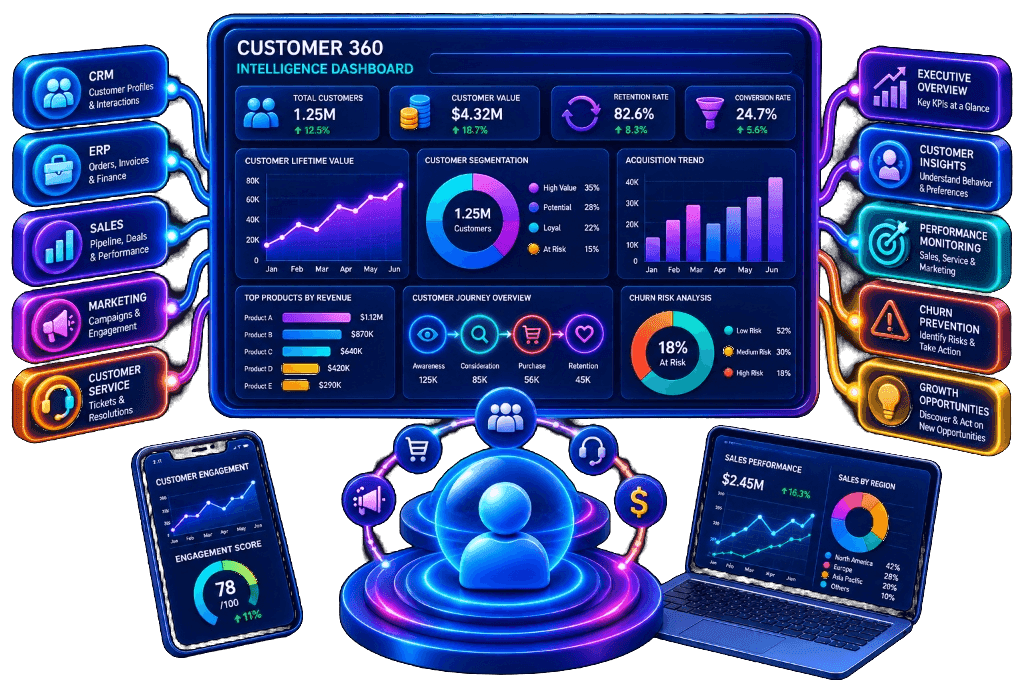
What Is a Customer 360 Customer Intelligence Dashboard?
A Customer 360 Customer Intelligence Dashboard is a centralized analytical interface that presents relevant customer information, metrics, trends, relationships, and insights from connected business data.
Customer Profile
Consolidated accounts, contacts & hierarchy
Customer Value
CLV, cumulative revenue & margins
Customer Engagement
Omnichannel touchpoints & session activity
Sales Activity
Pipeline progression, deals & rep velocity
Purchase History
Orders, SKU product mix & cadence
Product Usage
Telemetry, feature adoption & active seats
Customer Service
Support tickets, SLA times & escalations
Customer Journey
Sequential progression across lifecycle stages
Retention
Cohort curves & multi-year contract renewals
Churn Risk
Early disengagement signals & risk scoring
Renewals
Renewal pipeline, timing & probability
Cross Sell
Product affinity gaps & whitespace opportunities
Upsell
Usage tier capacity & upgrade triggers
Customer Experience
CSAT, NPS, CES & journey friction points
Predictive Insights
Propensity scores & forecasted customer outcomes
*The dashboard should be designed around business decisions rather than simply displaying large amounts of data.
Why Is a Customer 360 Dashboard Important?
Customer information is frequently distributed across systems. A Customer 360 dashboard brings relevant intelligence into role-specific analytical views:
Executives
Need high-level customer health, ARR, retention and strategic enterprise trends.
Sales Teams
Need account whitespace intelligence, deal pipeline, and cross-sell signals.
Marketing Teams
Need campaign influence, audience segments, and digital touchpoint engagement.
Customer Service
Need complete customer interaction history, open tickets, and escalation alerts.
Customer Success
Need product adoption telemetry, onboarding progression, and renewal risk.
10 Core Organizational Benefits of a Customer 360 Dashboard:
What Does a Customer 360 Dashboard Include?
Twelve specialized intelligence modules unifying customer data across systems:
Customer Profile
Relevant customer and account information.
Customer Value
Revenue, purchase value, customer lifetime value, or other relevant value measures.
Customer Engagement
Customer interactions across relevant communication and digital channels.
Sales Intelligence
Leads, opportunities, sales activities, and pipeline account progression.
Purchase Intelligence
Orders, purchases, product mix, transaction frequency, and order value.
Service Intelligence
Support cases, service interactions, first-contact resolution, and escalations.
Product Intelligence
Product adoption, telemetry, and license usage where relevant data is available.
Journey Intelligence
Customer progression and transition velocity through lifecycle stages.
Retention Intelligence
Retention rates, renewal health, and sustained engagement trends.
Churn Intelligence
Historical churn rates and validated early risk warning indicators.
Expansion Intelligence
Validated cross sell and upsell whitespace opportunities.
Predictive Intelligence
Relevant predictive scores, propensity models, and revenue forecasts.
How Does a Customer 360 Dashboard Work?
NuageCX executes a disciplined 12-step delivery lifecycle for high-performance dashboard engineering:
Define Business Objectives
Determine which customer decisions the dashboard needs to support.
Identify Users
Define whether views are for executives, sales, marketing, service, CS, or finance.
Identify Data Sources
Map relevant CRM, ERP, marketing, service, product, and e-commerce systems.
Define Customer Metrics
Determine the exact KPIs, formulas, time aggregations, and dimensions required.
Connect Customer Data
Integrate relevant data sources through automated pipelines and APIs.
Resolve Customer Identity
Connect records belonging to the same customer or account across systems.
Standardize Data
Create consistent data definitions, currencies, timestamps, and calculations.
Design Architecture
Organize metrics logically into intuitive analytical sections and layouts.
Build Visualizations
Create interactive charts, tables, scorecards, filters, and drilldowns.
Validate Business Logic
Ensure metrics and calculations accurately represent intended business rules.
Deploy Dashboards
Make dashboards securely available to authorized stakeholders with role security.
Monitor and Improve
Review user adoption, data freshness, quality, and new requirements continuously.
Role-Specific Customer 360 Dashboards
Tailored visual intelligence matching the daily workflows of each functional unit:
Executive Dashboard
High-level visibility without operational noise:
- • Total & active customers
- • Enterprise customer value & revenue
- • Customer retention & churn rate
- • Contract renewal forecasting
- • Customer engagement & acquisition
- • Account expansion velocity
- • Overall customer experience trends
Sales Dashboard
Actionable account intelligence for reps:
- • Inbound leads & qualified opportunities
- • Sales pipeline progression
- • Conversion velocity by stage
- • Account engagement scores
- • Complete purchase history
- • Cross sell & upsell whitespace
- • Contract renewal opportunities
Marketing Dashboard
Attribution, reach, and audience insights:
- • Customer acquisition cost & trends
- • Multi-touch campaign engagement
- • Lead generation by source
- • Dynamic customer segments
- • Marketing-influenced revenue
- • Channel conversion performance
- • Full journey touchpoint tracking
Customer Service Dashboard
Resolution quality and case trends:
- • Open & resolved support tickets
- • Case volume and SLA resolution times
- • Escalation rates & root causes
- • Chronic repeat issue analysis
- • Service interaction histories
- • Account monetary value weighting
- • Customer frustration risk signals
Customer Success Dashboard
Proactive account health management:
- • Overall customer health scoring
- • Feature adoption & product telemetry
- • User engagement & login cadence
- • Support interaction load
- • Contract renewal timeline & status
- • Churn early warning indicators
- • Account expansion potential
Finance Dashboard
Commercial health and payment behavior:
- • Real-time revenue & customer value
- • Order transaction records
- • Outstanding receivables & aging
- • Invoicing & payment behavior
- • Annual & monthly recurring revenue
- • Net customer account profitability
- • Contract renewal commercial value
Specialized Customer Intelligence Dashboards
Advanced architectural views connecting profiles, health, churn, lifetime value, funnels, and journeys:
Customer Profile Dashboard
Consolidates 10 core entity dimensions:
B2B Account Intelligence
Account-level command center:
- • Account profile & organizational tree
- • Multi-stakeholder contact network
- • Active pipeline deals & orders
- • Product portfolio in use
- • Support case history
- • Contract terms, SLAs & renewal dates
- • Account health & expansion whitespace
Customer Health Dashboard
Objective weighted scoring model:
- • Active product usage & seat consumption
- • Digital interaction cadence
- • Support ticket volume & severity
- • Order frequency & transaction cadence
- • Upcoming renewal status
- • CSAT / NPS indicators where available
- • Overall account engagement trends
Retention & Churn Dashboard
Multi-dimensional attrition monitoring:
- • Historical & current churn rates
- • Churn broken down by segment & tier
- • Churn by product line & geography
- • Churn across lifecycle stages
- • Validated early churn risk alerts
- • Cohort retention curves
- • Contract renewal percentage
CLV & Expansion Dashboards
Maximizing customer economic potential:
- • Historical, current & predicted CLV
- • Average order value & purchase cadence
- • Product gaps & affinity recommendations
- • Usage capacity limit tracking
- • Higher product tier upgrade signals
- • Account expansion history
- • Net revenue retention (NRR)
Journey & Funnel Dashboards
Progression tracking across 11 stages:
Monitors conversion velocity & drop-off between Visitors, Leads, Opportunities & Customers.
Connected Data Architecture & Governance
A dashboard is only as reliable as the underlying data, identity resolution, and business definitions:
10 Connected Data Sources
Ingesting signals across operational touchpoints:
Zoho Analytics Specialization
NuageCX leverages Zoho Analytics to engineer unified Customer 360 dashboards spanning Zoho CRM, Zoho Books, Zoho Desk, and third-party databases:
- • Cross-functional table joins & syncs
- • Custom SQL query tables & KPI formulas
- • Automated report distribution & alerts
- • Granular role-based row-level security
Identity Resolution & Governance
Ensures every transaction, ticket, and web visit maps to the authoritative Golden Customer Record:
- • Cross-system deterministic matching
- • Deduplication & data standardization
- • Data quality: completeness & accuracy
- • Access control, audit logs & security
Filters, Drilldowns, Alerts & Core KPIs
Empowering business teams to explore trends from high-level summaries down to individual interactions:
12 Dynamic Filters
Slice and dice analytical dimensions:
5-Tier Drilldowns
Investigate root causes effortlessly:
7 Proactive Alerts
Real-time notification triggers:
- • Significant churn changes
- • High-value renewal approaching
- • Customer engagement drop-off
- • Service escalation thresholds
- • Sudden revenue shifts
- • Customer health score drop
- • Validated expansion triggers
19 Core Customer 360 Dashboard KPIs:
Customer 360 Dashboard Design Best Practices
Proven design standards to ensure high user adoption and direct decision support:
Start With Decisions
Define what users need to decide before selecting visualizations.
Prioritize Important KPIs
Do not overload the dashboard with unnecessary vanity metrics.
Use Consistent Definitions
Ensure every team uses the exact same KPI definitions and calculations.
Provide Context
Show historical trends, targets, and benchmarks where meaningful.
Enable Drilldowns
Allow users to investigate changes from executive summary to root detail.
Keep Roles Separate
Executive and operational dashboards should not be identical.
Make Freshness Clear
Users should always know when underlying data was last refreshed.
Validate Calculations
Ensure all business formulas are rigorously tested before deployment.
Protect Sensitive Data
Apply appropriate role-based row and column level security controls.
Design for Action
Every important metric should directly support a meaningful business decision.
Dashboard Implementation Roadmap
NuageCX executes structured, validated 11-phase dashboard delivery programs:
Phase 1: Business Requirements
Define dashboard objectives, target user personas, and core decisions.
Phase 2: KPI Definition
Define metrics, calculation formulas, time horizons, and targets.
Phase 3: Data Source Mapping
Identify source systems, tables, fields, and integration interfaces.
Phase 4: Data Integration
Connect relevant sources into an automated pipeline architecture.
Phase 5: Identity Resolution
Connect relevant customer and account records across systems.
Phase 6: Data Modeling
Create the analytical data warehouse structure and unified views.
Phase 7: Dashboard Design
Create role-specific wireframes and analytical layouts.
Phase 8: Visualization
Build interactive charts, scorecards, filters, and drilldowns.
Phase 9: Validation
Validate data accuracy, calculations, and business logic with users.
Phase 10: Deployment
Make dashboards available to authorized stakeholders with role security.
Phase 11: Optimization
Review user adoption, performance, and evolving requirements.
How Much Does It Cost?
Cost depends on data sources, integration complexity, dashboard requirements, data volume, KPI complexity, real time requirements, security, governance, and predictive analytics requirements.
- Number of source data systems
- Number of distinct dashboard views
- Integration & transformation complexity
- Real-time vs. batch latency needs
How Long Does It Take?
The timeline depends on data availability, number of systems, integrations, identity resolution, dashboard requirements, KPI complexity, and governance.
- Data source readiness & access
- Identity resolution complexity
- Business KPI definition consensus
A single executive dashboard can have a substantially different implementation timeline from an enterprise-wide analytics environment.
6-Phase Phased Rollout
When Should a Business Implement a Customer 360 Dashboard?
Key Conceptual Differences & Technical FAQs
Clarifying core architectural relationships:
Customer 360 Dashboard vs. CRM Dashboard
A CRM dashboard primarily analyzes information stored in or connected to the CRM.
A Customer 360 dashboard combines relevant information across CRM, ERP, marketing, service, e-commerce, product, finance, and other systems to provide a broader customer view.
Customer 360 Dashboard vs. Customer Profile
A customer profile focuses on information about an individual customer or account.
A Customer 360 dashboard provides analytical views across customers, segments, trends, metrics, and business outcomes.
Customer 360 Dashboard vs. Journey Analytics
A Customer 360 dashboard can contain many types of customer intelligence.
Customer Journey Analytics specifically analyzes customer progression and interactions across lifecycle stages. Journey analytics is one component of a broader Customer 360 dashboard.
Customer 360 Dashboard vs. Data Integration
Customer Data Integration connects relevant customer information across systems.
A Customer 360 dashboard uses connected information to present analytical insights.
Why Choose NuageCX for Customer 360 Dashboards?
Connecting CRM, ERP, and operational data into role-specific decision command centers:
Connected Customer Intelligence
Bring relevant customer information together from multiple business systems.
Role-Specific Dashboards
Create dashboards designed around executive, sales, marketing, service, and success decisions.
Customer Profile Intelligence
Provide relevant customer and account context in consolidated views.
Customer Journey Analytics
Visualize customer progression across lifecycle stages.
Customer Behavior Analytics
Analyze customer actions, engagement, purchases, usage, and interactions.
Retention and Churn Analytics
Monitor customer retention and validated churn indicators.
Customer Value Analytics
Analyze revenue, CLV, purchase frequency, and other relevant value measures.
Cross Sell and Upsell Analytics
Identify potential account expansion opportunities.
Predictive Customer Analytics
Support validated predictive customer intelligence use cases.
Zoho Analytics Expertise
Build Customer 360 dashboards using relevant Zoho applications and connected systems.
End-to-End Customer 360 Analytics
Support data discovery, integration, identity resolution, modeling, design, deployment, and governance.
Frequently Asked Questions
Everything you need to know about Customer 360 Customer Intelligence Dashboards.
Turn Connected Customer Data Into Actionable Intelligence
A Customer 360 dashboard should do more than display customer data. It should help the right people understand customer behavior, identify important trends, investigate opportunities, monitor risks, and make better customer decisions.