Customer 360 Customer Experience Analytics Services
Understand how customers experience your business across interactions, channels, products, sales, service, and lifecycle stages with Customer 360 Customer Experience Analytics.
NuageCX helps businesses connect relevant customer data and analyze customer experience across the complete customer journey. The objective is to identify experience gaps, understand customer behavior, measure engagement, uncover friction, and create actionable insights for improving customer relationships.
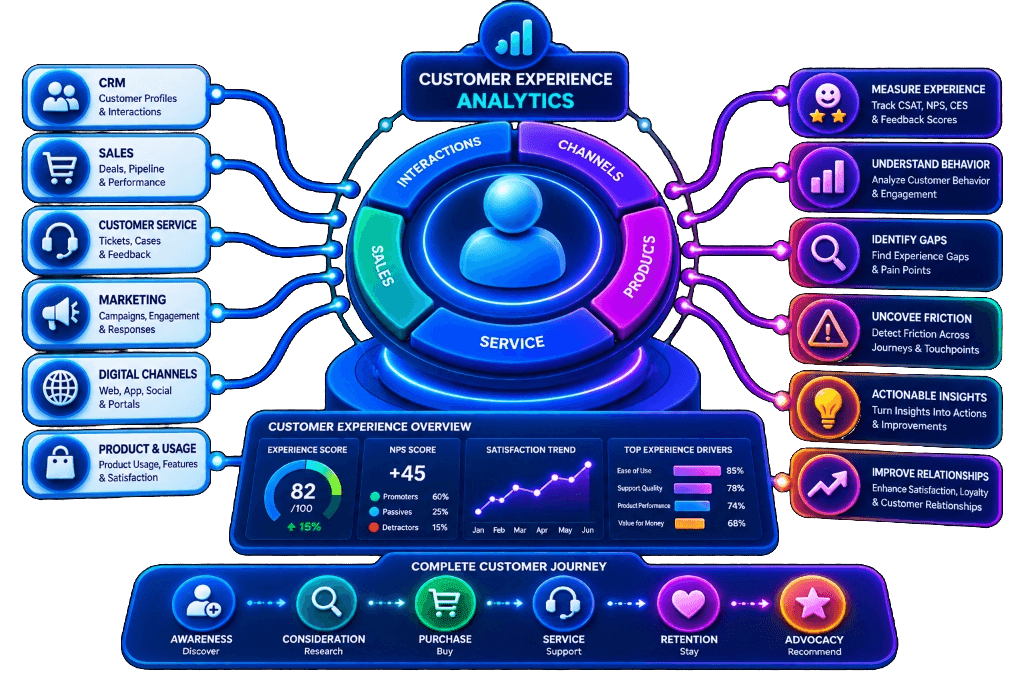
What Is Customer 360 Customer Experience Analytics?
Customer 360 Customer Experience Analytics is the analysis of connected customer data to understand how customers interact with a business across their lifecycle.
CRM Systems
Pipeline interactions & rep notes
ERP Databases
Orders, invoices & fulfillment timelines
Marketing Platforms
Campaign responses & ad touchpoints
Sales Touchpoints
Meetings, proposals & deal velocity
Customer Service
Support cases, resolution & escalations
E-commerce Platforms
Checkout, cart activity & product views
Product Systems
In-app usage telemetry & feature adoption
Customer Portals
Self-service usage & account administration
Website Analytics
Page views, sessions & digital drop-offs
Surveys & Feedback
CSAT, NPS, CES & freeform reviews
Transaction Systems
Recurring billing & payment success rates
*The objective is to understand the customer experience using measurable data rather than relying on isolated interactions or departmental reports.
Why Is Customer Experience Analytics Important?
Customer experience is created across multiple interactions. Each touchpoint influences the overall customer relationship:
Discover
Discover via marketing & campaigns
Visit
Visit company website & portal
Contact
Contact sales reps & ask questions
Purchase
Complete product order or contract
Onboard
Receive guided onboarding & setup
Use
Use the product or service daily
Support
Contact customer support for help
Renew
Renew or evaluate continuing
Expand
Purchase additional products
Customer 360 Customer Experience Analytics connects relevant information across these interactions to help businesses understand where experiences are working and where improvement may be required.
What Does Customer 360 Customer Experience Analytics Include?
Eleven comprehensive analytical modules unifying interactions, operations, and feedback:
Customer Journey Analytics
Analyze customer progression across defined lifecycle stages.
Interaction Analytics
Analyze relevant customer interactions across channels.
Engagement Analytics
Measure customer engagement and digital touchpoint activity.
Feedback Analytics
Analyze structured customer feedback and survey information.
Customer Service Analytics
Analyze support interactions, SLA times, and service performance.
Behavior Analytics
Identify meaningful and changing customer behavior patterns.
Satisfaction Analytics
Monitor defined satisfaction metrics (CSAT, NPS, CES).
Retention Analytics
Analyze retention rates, renewal trends, and churn drivers.
Customer Health Analytics
Monitor defined customer health and adoption indicators.
Experience Dashboards
Present CX metrics and trends through role-specific dashboards.
Predictive CX Analytics
Use validated predictive models for churn and experience risk.
How Does Customer 360 Experience Analytics Work?
NuageCX executes a 12-step operational methodology to turn raw interaction data into actionable experience enhancements:
Define Experience Objectives
Determine which customer experience outcomes need to be measured.
Map the Customer Journey
Identify relevant customer lifecycle stages and critical touchpoints.
Identify Data Sources
Determine where customer interactions and experience data are stored.
Integrate Relevant Data
Connect appropriate customer, transaction, interaction, product, and service data.
Resolve Customer Identity
Associate relevant interactions with the correct customer or account.
Standardize Data
Create consistent definitions, structures, and normalized data formats.
Define Experience KPIs
Determine the metrics that accurately represent customer experience.
Analyze Customer Behavior
Identify patterns, trends, friction points, and engagement changes.
Build Experience Dashboards
Create role-specific analytical views for frontline and leadership teams.
Identify Experience Gaps
Determine where customer interactions or journeys require improvement.
Connect Insights to Actions
Create appropriate business processes for addressing identified issues.
Measure Outcomes
Track whether experience improvements produce the intended business results.
Core Experience Analytics Deep Dives
Multi-dimensional analysis connecting journeys, touchpoints, feedback, sentiment, onboarding, and product telemetry:
Customer Journey Analytics
10-stage sequential journey mapping:
Touchpoint Analytics
Relevance over simple volume counts:
Voice of Customer & Sentiment
NLP text extraction across 6 channels:
- • Relational & transactional surveys
- • Public reviews & ratings
- • Support transcripts & call notes
- • In-app feedback widget forms
- • Executive customer interviews
- • Categorized: Positive, Neutral, Negative
Service Experience Analytics
Resolution quality and customer impact:
- • Case volume and arrival velocity
- • First response & resolution time
- • Escalation rates & root causes
- • Repeat ticket contacts
- • Customer satisfaction (CSAT)
- • Account economic value weighting
- • Retention correlation analysis
Onboarding Experience Analytics
Driving rapid time to first value:
- • Milestone completion percentage
- • Time to initial activation
- • Early customer engagement cadence
- • Product feature adoption speed
- • Training attendance & certification
- • Support tickets logged during setup
- • Onboarding drop-off identification
Product & Digital Experience
In-app behavioral usage signals:
- • Telemetry: active seats & login cadence
- • Core feature adoption & drop-off
- • Usage frequency and session depth
- • Digital navigation friction points
- • Mobile app vs web portal adoption
- • Campaign landing page conversion
Industry-Specific Customer Experience Analytics
Tailored experience models reflecting the distinct relationship structures of different business types:
B2B Accounts
Multi-stakeholder complexity:
- • Contact & account level views
- • Multiple buyer personas
- • Sales touchpoint progression
- • Service contract health
- • Multi-year renewal stability
B2C Consumers
High-volume consumer trends:
- • Omnichannel touchpoints
- • Purchase cadence behavior
- • Digital portal engagement
- • Consumer feedback & CSAT
- • Repeat order velocity
SaaS Businesses
Product-led lifecycle stages:
- • Trial activation velocity
- • Feature adoption curves
- • Support load during setup
- • Product health scoring
- • Net expansion & churn
E-commerce
Digital discovery & conversion:
- • Website session browsing
- • Cart abandonment friction
- • Delivery & unboxing feedback
- • Return processing experience
- • Customer lifetime value
Manufacturing
Supply chain & fulfillment:
- • Order delivery timelines
- • Service part fulfillment
- • Product quality telemetry
- • Repeat wholesale purchase
- • Long-term account loyalty
Experience Analytics in the Customer 360 Ecosystem
Connecting front-office customer sentiment with back-office operational realities:
CRM & ERP Context
CRM data provides sales opportunities, communication logs, and account lifecycle history.
ERP data provides fulfillment timelines, invoice accuracy, payment history, and delivery performance.
Customer Service & Support
Support interactions are direct indicators of customer friction. Combining service logs with customer lifetime value, purchase history, and product usage provides a complete view of experience health.
Identity Resolution Across 5 Levels
Associates fragmented interactions with the authoritative Golden Record:
Customer Experience Dashboards & Core KPIs
Role-specific visual analytics designed around customer relationship outcomes:
Experience Overview
- Satisfaction metrics
- Customer engagement
- Retention & churn
- Health scores
Journey Performance
- Progression velocity
- Stage conversion
- Drop-off points
- Time between stages
Service Experience
- Case volumes
- Response & resolution
- Escalations
- Repeat contact rates
Customer Feedback
- Feedback volume
- CSAT / NPS trends
- Sentiment distribution
- Recurring themes
Customer Value
- Revenue correlation
- Customer lifetime value
- Purchase frequency
- Expansion revenue
19 Core Customer Experience Analytics KPIs:
Experience Frameworks: NPS, CSAT & CES Contextualized
Survey scores must be analyzed alongside operational and behavioral telemetry rather than in isolation:
Net Promoter Score (NPS)
NPS is one relational indicator, but does not represent the full customer experience on its own.
NuageCX connects NPS with: Product usage telemetry, purchase activity, support tickets, and contract renewals to validate whether high promoters actually buy and renew more.
Customer Satisfaction (CSAT)
Measures satisfaction for a specific event (e.g. post-service ticket or onboarding milestone).
NuageCX connects CSAT with: First-contact resolution rates, agent handling time, and long-term account health to separate momentary satisfaction from lasting retention.
Customer Effort Score (CES)
Measures the perceived difficulty of completing an interaction or resolving an issue.
NuageCX connects CES with: Journey drop-offs, repeat support touches, and early churn signals, isolating the exact friction points driving customer fatigue.
Predictive CX, AI & Experience Automation
Transforming historical customer telemetry into proactive interventions:
8 AI Applications in CX Analytics
Experience Automation Workflow
Connecting experience signals directly to frontline operational workflows:
*Automation uses strictly governed business rules to ensure customer interventions remain authentic, relevant, and effective.
Customer Experience Analytics Use Cases
Solving critical friction points and unlocking commercial expansion:
Identify Customer Friction
Find stages or interactions where customers experience measurable difficulties.
Analyze Customer Drop Off
Identify exactly where and why customers stop progressing through a defined journey.
Improve Onboarding
Analyze onboarding completion times and product adoption patterns to reduce early churn.
Improve Customer Support
Identify chronic recurring service issues and root causes driving customer frustration.
Improve Product Adoption
Analyze product telemetry and feature usage to guide customer enablement.
Improve Customer Retention
Analyze behavioral indicators and disengagement signals associated with customer churn.
Improve Contract Renewals
Monitor customer health and renewal indicators 90-120 days ahead of expiration.
Identify Expansion Opportunities
Analyze product usage capacity, account growth, and value for upsell/cross-sell.
Customer Experience Challenges
Customer Experience Best Practices
Experience Analytics Implementation Roadmap
NuageCX delivers structured, validated 11-phase experience analytics programs:
Phase 1: Business Objectives
Define target customer experience outcomes and priorities.
Phase 2: Journey Mapping
Map relevant customer lifecycle stages and critical touchpoints.
Phase 3: Data Discovery
Identify operational systems, tables, and feedback repositories.
Phase 4: Data Integration
Connect relevant customer information across applications.
Phase 5: Identity Resolution
Connect customer records and touchpoints into a unified profile.
Phase 6: KPI Definition
Define consistent experience metrics and calculation formulas.
Phase 7: Analytics Model
Create the analytical data model and unified data warehouse.
Phase 8: Dashboard Development
Build role-specific customer experience dashboards.
Phase 9: Validation
Validate data accuracy, formulas, and business logic.
Phase 10: Deployment
Provide access to authorized teams with role-based security.
Phase 11: Optimization
Continuously improve analytics based on feedback and business needs.
How Much Does It Cost?
Cost depends on data sources, integration complexity, journey requirements, dashboards, KPIs, AI, predictive analytics, real time requirements, and governance.
- Number of source data systems
- Customer journey complexity
- AI & text analytics requirements
- Predictive modeling scope
How Long Does It Take?
The timeline depends on data availability, system integrations, customer identity complexity, journey requirements, dashboard scope, and analytics requirements.
- Data source accessibility
- Identity resolution complexity
- Departmental KPI alignment
A focused experience dashboard can require significantly less effort than an enterprise-wide analytics environment.
7-Phase Iterative Rollout
When Should a Business Implement Experience Analytics?
Key Conceptual Differences & Technical FAQs
Clarifying core architectural relationships:
CX Analytics vs. Journey Analytics
Customer Journey Analytics focuses specifically on customer progression through defined journey stages.
Customer 360 Experience Analytics is broader and includes journey, behavior, service, feedback, engagement, value, and retention analytics.
CX Analytics vs. Behavior Analytics
Customer Behavior Analytics focuses on what customers do.
Customer Experience Analytics uses behavioral, operational, feedback, and journey information to understand the quality and outcomes of customer interactions.
CX Analytics vs. Satisfaction Analytics
Customer Satisfaction Analytics focuses on survey scores.
Customer Experience Analytics provides a broader view combining satisfaction, behavior, engagement, journey, service, product, and retention data.
CX Analytics vs. Customer Data Integration
Data integration connects customer information across systems.
Experience analytics analyzes that connected information to understand customer interactions, journeys, and business outcomes.
Why Choose NuageCX for Experience Analytics?
End-to-end data science engineering, unified data architecture, and turnkey Zoho Analytics deployment:
Connected CX Data
Connect relevant customer information across all enterprise systems.
Customer Journey Intelligence
Analyze customer progression and drop-offs across lifecycle stages.
Customer Behavior Analytics
Understand customer actions, engagement, purchases, and product usage.
Customer Feedback Analytics
Analyze structured feedback and qualitative Voice of Customer information.
Customer Service Analytics
Connect support interactions with broader customer and economic context.
Retention & Churn Analytics
Monitor retention, renewal health, and validated churn risk indicators.
Customer Value Analytics
Analyze revenue, purchase activity, customer lifetime value, and expansion.
Predictive CX Analytics
Support validated predictive use cases including churn and engagement.
AI-Enabled Analytics
Apply appropriate AI techniques for sentiment, text, and anomaly detection.
Zoho Analytics Expertise
Build Customer 360 experience dashboards using Zoho applications and external databases.
End-to-End Analytics
Support data discovery, integration, identity resolution, modeling, design, validation, and governance.
Frequently Asked Questions
Everything you need to know about Customer 360 Customer Experience Analytics.
Build a More Complete View of Customer Experience
Customer experience is not defined by a single interaction or department. It is shaped by the complete relationship between a customer and a business.